 Diamonds Act, 1986
R 385
Electricity Regulation Act, 2006 (Act No. 4 of 2006)NoticesIntegrated Resource Plan 20196. Appendices6.4 Appendix D : Summary of Published Draft IRP 20186.4.5 Published Draft IRP 2018 Electricity Tariff Path Comparison |
Tariff path analysis was done for the five key input scenarios , namely no RE annual build rate (IRP1), median growth (IRP3), market-linked gas price (IRP5), carbon budget (IRP6) and carbon budget plus market-linked gas price (IRP7).
Data for the Price Path Model (PPM) used for the analysis came from Eskom’s Financial Statements and Revenue Application of April 2017, and output of the scenarios from technical models.
The PPM simulates the regulatory pricing methodology for South Africa. The model forecasts Eskom’s total costs, including generation, transmission, purchases and distribution. The PPM does not forecast municipal costs.
Key assumptions in the Model can be summarised as follows:
| • | from financial year 2017/18, the tariffs will immediately move to ‘cost-reflective’ levels as per the NERSA methodology. |
| • | No change in Eskom’s current level of performance and efficiency. |
| • | Eskom will build nuclear and the rest of the capacity will be built by another party. |
| • | Eskom will be responsible for developing new transmission and distribution networks. |
The table below shows the comparative tariff projections for each of the five input scenarios and the cumulative difference between the scenarios11 by 2030.
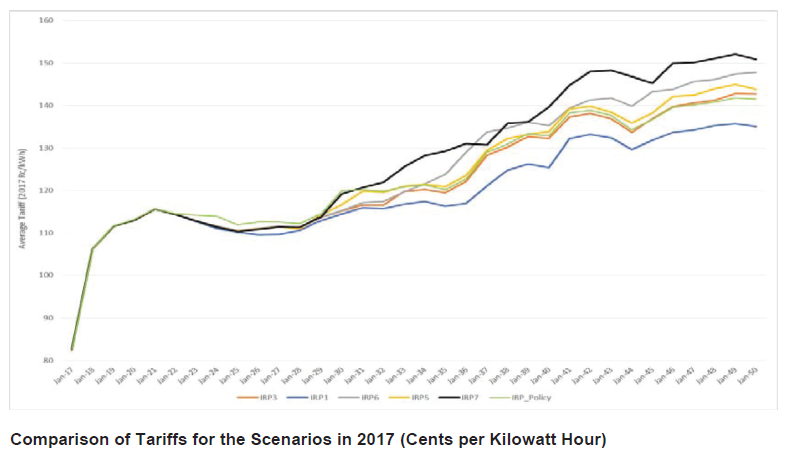
There is a marginal difference in the projected price path for the period up to 2030. This is to be expected, since technical analysis resulted in the observation that the energy and capacity mix for the period differs marginally between the five scenarios.
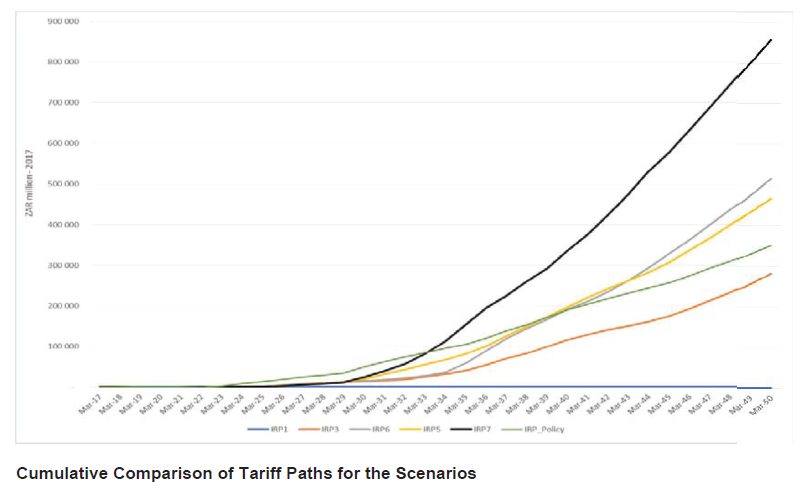
Beyond 2030, and driven by the difference in the energy and capacity mix, the price paths are significantly different. The scenario where annual build limits on RE is removed (IRP1) provides the lower-tariff path, with the scenario where carbon budget as emission mitigation strategy is imposed and market-linked gas prices are assumed (IRP7) resulting in the highest tariff path. A further observation was that the adoption of carbon budget as emission mitigation strategy, with the targets as currently suggested, results in the tariff path of this scenario being the second highest by 2050 (see IRP6).
There is therefore no difference in tariff path for the different scenarios up to 2030, while the choice of technologies and their associated costs, taking emission mitigation requirements and capacity building into account, will drive the price path beyond 2030. Cumulative by 2030 deviation from the least cost case (IRP1) will results in additional costs to the consumer.
Hence, it makes no difference for this version of the IRP Update which scenario is adopted up to 2030. The huge difference between scenarios beyond 2030 will, however, make it necessary to undertake a detailed energy path study that will inform a next update of the IRP.
The policy adjusted scenario will result in about 5% higher tariff by year 2030 compared to the least cost scenario. This is the results of the smoothing out RE rollout plan which commissions plants earlier than they are actually required by the system as well as the introduction coal and hydro power. It must be noted this financial analysis does not take into account the economic benefits of a consistent and predictable RE rollout, the likely regional economic benefits of Inga hydropower as well as the economic benefits of continued beneficiation from coal.
_______________________________________
11 No RE annual build rate (IRP1), median-growth (IRP3), market-linked gas price (IRP5), carbon budget (IRP6) and carbon budget plus market-linked gas price (IRP7) scenarios.