 Housing Development Agency Act, 2008
R 385
Usury Act, 1968 (Act No. 73 of 1968)Report on Costs and Interest Rates in the Small Loans Sector4. Findings from the Information gathering exercise |
| 4.1 | Introduction |
A wide range of methods has been applied to gather useful information over a short period of time at a reasonable cost Although the results from these efforts will be touched on in many sections of this report we provide a summary of the analysis of information obtained in this section. We focus our discussion on the requirements of the terms of reference. In the proposals section we will provide ancillary discussions to contextualise our proposals.
In this section we will address the results of the several data gathering exercises. We will first deliberate on the date provided by the MFRC. This will be applied to look at the cost components of lending of different categories of lenders. These will range from microlenders providing cash and term loans to parastatal institutions. We will also look at the cost estimates provided to us by industry organisations and individual institutions (these will not be identified, as this was the agreement when the data was obtained from individual institutions).
| 4.2 | Cost of lending by category based on MFRC Information |
The detailed information supplied by the MFRC and the financial statements of institutions also supplied by the MFRC were merged in one database reflecting a sample of 90 institutions drawn from the more than 800 registered institutions as at the end of February 2000. lnformation fields covered are reflected in Table 10.
Table 10: Information fields in the MFRC database
|
Legal Status. |
Address |
Name and contact |
Revenue (time periods) |
|
Loan Book |
Clients |
Branches |
Purpose of loans |
|
Monitoring method |
Turnover |
Income profile |
Loan terms |
|
Loan status |
Repayment frequency |
Income detail |
Expenditure detail |
|
Profits and tax |
Assets detail |
Liabilities detail |
Some ratios |
The characteristics of the institutional groups active in the Microfinance sector have been detailed in section 2. This will not be repeated here. In section 2 the institutions have also been divided into groups. We follow that taxonomy also presenting information on cost of lending. Also, in section 2 detailed discussion was provided on the issues around profitability of microfinance institutions. That also is not repeated.
Based on the information supplied a cost profile was calculated for different institutional groups. One clear differentiation in the sector (although it is slowly starting to blur at the edges) is purpose of loan. There is a distinct difference on the basis of several variables between enterprise financiers and consumer finance financiers. Traditionally the enterprise financiers came in the format of parastatals and NGOs. Recently there have been examples of microenterprise financiers in the form of for profit businesses. We also estimate that a fair percentage of loans obtained for consumer finance purposes land as investments in small businesses. Money is fungible and where limited opportunities exist for a generation of income from wages or salaries people will add other activities to ensure a higher income.
Our first option for grouping therefore is on the basis of enterprise finance vs. consumer finance. In the group focusing on consumer finance a wide range of institutions operate. It must be noted that the first hurdle to cross was to decide on which basis the grouping within the consumer finance group of institutions should be done. Turnover would have provided us with groups in terms of size. However, this ignores the life cycle phase a specific institution is experiencing. The same is true for number of clients and loan volume. During the research period and based on our analysis of the volatility and change continuously experienced in quite a new sector as well as the obvious differences between institutions Interviewed in terms of term of ban emphasis, it was decided to group institutions on the basis of ban term. Thus we used this as the overall criteria. We see the industry moving to institutions that supply a diverse range of products (whether in the same or a range of institutions) and thus it will become more difficult over time clearly differentiate. Further, most of the microenterprise finance institutions struggle to reach operational self-sufficiency. This is due to numerous problems that will not be detailed here, however, it means that we cannot base interest rate or cost of operations discussions on their information.
Three groups were identified viz., one month lenders (referred to as the cash lenders), one to six month lenders and those that concentrate on loan terms longer than 12 months (referred to as term lenders). Note that nearly 50 percent of these institutions provide a range of products in terms of loan term. Our grouping is based on the term emphasised by the institution indicated by at least 70 per cent of the business originating from a specific term product.
The financial information supplied to the MFRC during application for membership served as the basis for our calculations of cost components of these institutions. We concentrated on grouping the information into four categories, namely, administration costs, cost of capital, risk costs and surplus before tax (see discussion on these components in section 1.2.4). Thus it also serves as a summary of the income statement of these institutions.
Figure 8: Cost Components of Cash Lenders
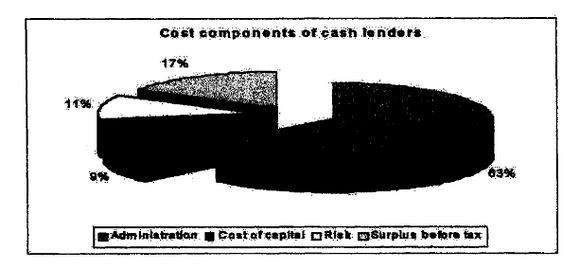
Figure 8 indicates that the bulk of the costs of cash lenders are administration costs. Cost of capital and risk costs contributes the minor proportions to the overall cost structure.
It also shows that the cost-to-income ratio [12] of cash lenders is on average 83 per cent for those registered with the MFRC. This is a relatively high ratio compared to the average for the whole microfinance sector, which is 6l percent.
Figure 9 indicates the cost components of the 1 to 6 month lenders.
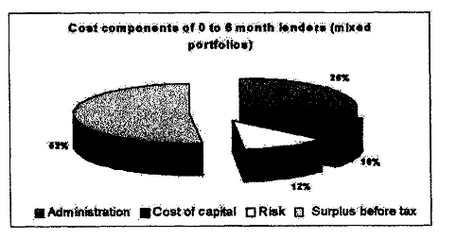
Figure 9: Cost Components of 0-6 month lenders
In this group risk increased and administration costs decreased tremendously. The ratio of cost-to-income is 48 per cent, which is a quite low level in general commercial banking terms.
Figure 10 indicates the cost components of the group that provide term loans (those with loan terms longer than 6 months).
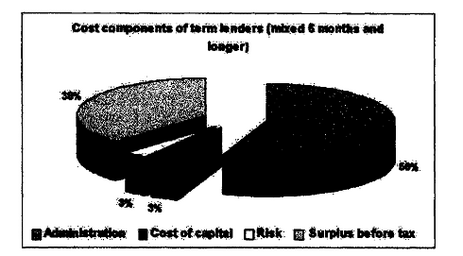
Figure 10: Cost components of term lenders
It is clear that there is a marked difference between the cost elements of the 1 to6 month and the term lender groups. The cost-to-income ratio is 62 per cent, which compares favourably with those of commercial banks in South Africa. Administration costs are surprisingly high since most of these institutions make use of payroll deductions and thus direct debits to their accounts. This is why the risk costs attached to term lenders are normally lower than for shorter term and specifically cash lenders which Is echoed by the level of the risk component (at 3 %) for term lenders.
Table 11: Cost components for different groups based on MFRC data
|
Cash Lenders |
1 to 6 months |
Term Lenders |
|
|
Administration costs |
63(75) |
26(54) |
56(90) |
|
Cost of capital |
9(11) |
10(21) |
3(5) |
|
Risk costs |
11(13) |
12(25) |
3(5) |
|
Surplus before tax |
17 |
52 |
38 |
|
Cost-to-income ratio |
83 |
48 |
62 |
|
(x) indicates the percentage of total expenses |
|||
When studying the three groups it is clear that cost of capital and risk costs are not as significant as the level of administration costs for these institutions. Thus changes in prime rates or other standard measures of the cost of capital will have a negligible effect on the cost structure of microlenders. Anything that increases administration costs [13] would most definitely have an effect on the bottom line of these institutions and especially the smaller institutions, thus mostly the cash lenders. The term lenders are normally operating at a bigger scale and are far more sophisticated in terms of premises and technology.
The assessment of the efficiency and level of return on investment by microlenders gave a wide range of re The use of a ratio like return on equity that indicates the profitability of applying own funds in a microlending organisation resulted in a range of mostly meaningless answers. This is due to the fact that many of these firms start with very low levels of equity and it results in very high ROE ratios. The differences are once more vivid between the cash lenders and the term lenders. We tried several ratios to depict efficiency and return (see discussion in section 12.2). We settled on a basic ratio indicating the relationship between expenditure and income referred to as the cost-to-income ratio.
This ratio is used widely in the banking industry and South African banks reaching cost-to-income ratios of 55 per cent are considered to be quite efficient Figure 5 provides the cost to income ratios for South African banks over the last 5 years. However, as is the case with the difference between the cash lenders and the term lenders one also has to contextualise the banks that you are comparing on the basis of this ratio. A bank may have only high value clients (in terms of net worth of clients) and that may imply that loans are normally bigger and cost per loan lower. This will in turn force the cost-to-income ratio lower. Another bank may have a large presence in the lower value client market (those clients with lower net worths) and this will imply smaller Rand volume transactions per client, that increases administrative cost per transaction and forces the cost-to-income ratio upwards.
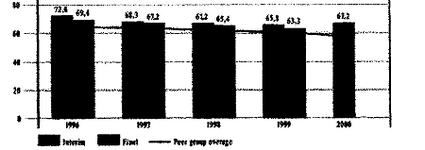
Figure 11: Cost-to-Income ratio for ABSA and peer group average 1996 to 2000
Thus the cost-to-income ratio is widely used in the banking sector as an indication of operational efficiency. It is not yet clear what the standards are for the microlending sector in South Africa. As the sector’s growth has been phenomenal and most of the institutions operating in the sector are recent creations one would expect higher cost-to-income ratios that will decrease over time.
Commercial banks also report on operating expenditure as a percentage of average assets to indicate efficiency of asset utilisation.
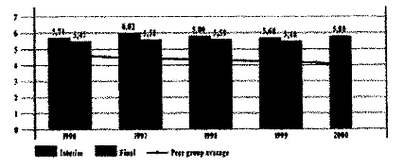
Figure 12: Operating expenditure as a % of average assets of ABSA and peer group banks
We have compared expenditure with the assets [14] of the microfinance institutions. The average for the sector is 22 percent This is far in excess of the 4.11 percent average for the commercial banking sector in South Africa, which is a clear illustration of the higher cost structure of the microfinance sector and the lower entry-level requirements of the microfinance sector.
In this section we have provided an argument for grouping the microfinance institutions and indicated efficiency ratios and cost components for the different groups. It is clear from the arguments and evidence presented that there are distinct differences between the groups identified which necessitate different approaches with each group. Further, the arguments presented earlier about volume of loans and number of clients in each grouping should now be compared with the findings of this section. We return to this argument in section 6 where we will summarise the findings of the study before we present the recommendations in section 7.
| 4.3 | Information from the survey of microlenders |
This section reports on the fieldwork done during April 2000. It presents the views of the micro lenders and outlines the results obtained from the field survey of 24 microlenders. During the course of the fieldwork two groups within the industry were interviewed, the cash lenders and the term lenders. They also differ on interest charges.
While getting the views about the industry one could detect that those offering short-term loans do not support the Governments activities around the changing of the Usury Act. A number of reasons were highlighted. Firstly the cash lenders argue that the Government has taken away their only form of security, namely the bankcard. In addition they didn’t (government) come up with a better recovery method, which resulted in the cash lenders losing larger sums of money. Secondly they argue that since the term lenders are granted access to PERSAL codes they take all the money, and by time the borrower receives her salary she is unable to repay basic. his loan to them. They argue that since they do not have the privileges enjoyed by the term lenders by having access to PERSAL stop orders they are highly exposed to risk. The cash lenders also do not have huge amounts of capital as they use their own capital as compared to long-term lenders who get loans from commercial banks (their perception).
As mentioned there are two distinct markets in the sector, the first being the so called 30 days 30% short-term loans (cash lenders) and the other is the long-term with loans of 12 to 36 months (term lenders). From the information gathered most cash lenders if not all charge interest, rates of 30% per month and this is the interest charge agreed upon by their association (MLA). Only few charge interest rate of below 30% and these are the ones, who intend offering longer-term loans. The term lenders interest rate range from 2.57 to 9.1 percent per month. But one has to realise that some lenders add charges in addition to the interest charge~ this includes administration fee and range from R200 to R450 depending on the size of the loan. In addition to admin fee others charge insurance against death and retrenchment and funeral cover, but the charges differs according to the size of the loan. The cash lenders also have the perception that the term lenders have decreased their rates over the last two years. Their own rates stayed constant.
Most cash lenders argue that if the Department tampers with the interest rate it will force them out of business, resulting in hundreds losing jobs. But some stated dearly that if that happens they would have, no alternative but to operate underground. They argue that their costs are too high and the business is risky, and the cost of going informal are minimal. Risks which organisations face are almost the same, most emphasising borrowers not being able to repay because of various reasons. As a result of non-payment they are forced to take the matter to court; which create more costs. This usually happens to cash lenders, as they do not have convenient mechanisms of collecting money, as is the case with term lenders. They usually rely on borrowers to repay their loans in cash, now that the bank card and PIN have been eliminated. Another risk faced by both cash and term lenders is retrenchment of mostly civil servants. One important aspect raised by nearly all the organisations is that people tend to overload themselves with debt. You find that one person has acquired loans from five different organisations and by the end of month all organisations have to deduct their money, which results in the individual taking home nothing. Sometimes not all organisations get their money back and normally those who suffer are the cash lenders because they rely on the borrower to come forward and pay in cash. Other issues raised are death of client clients disappearing, and also not stable in their jobs, they change jobs every month, which is difficult and costly to trace.
One important observation during the fieldwork is competition. One would never walk more than 200 meters without seeing a cash lender outlet In Durban it was even worse as in the building in which two interviews were conducted the cash lenders occupy 80 percent of the offices. This shows that this industry is very big and lenders are in tough competition.
| 4.4 | Information from the PERSAL database and the survey of informal lender clients |
4.4.1 Introduction
Although most of section 4 covers the supply side of the microfinance sector it is also important to look at the situation and perceptions of clients. Many publications and newspaper and magazine articles have highlighted the plight of clients in detail when trapped in a debt spiral. Few have highlighted the success stories of clients that had access to services that help to smooth consumption in times of financial shock. One could also question the distribution of client distress, is it really a major problem? What percentage of the market is in distress? We turn to answers to two sets of data, the survey of informal lender clients in the Pietersburg area by the University of Pretoria and the analysis of information on microlending captured on the PERSAL database of the Department of State Expenditure.
4.4.2 Survey of informal lender clients
This survey was executed earlier this year in the pen-urban and rural areas to the east and south-east of Pietersburg. In total 193 clients were interviewed. In the next table we are summarising the client profile. Note that we are using this data based on a preliminary analysis. The first section of the table provides demographic overview of the clients.
Table 12: Demographic overview of clients interviewed in the informal finance survey
|
Female clients |
52% |
Similar to PERSAL (see next section) |
|
|
Age classes Below 25 26-30 31-49 50 and more |
Percent 1.6 14.5 51.3 32.7 |
This supports the life cycle approach to savings, except for the 50 and more class, where use of accumulated savings should be seen, however, similar in other surveys |
|
|
Highest Education None Primary Secondary Diploma Degree Other |
Per cent 4.1 10.4 51.8 22.8 9.8 1.0 |
In this sector very few people will have low education as educational level is important in obtaining a job, thus indirect eligibility criteria for a loan as well |
|
|
Occupation None Pensioner Driver Labourer Self employed Professional |
Per cent 8.3 15.0 7.3 19.2 3.1 47.2 |
The professional refers mostly to state employees. Teachers, nurses, policeman, soldiers, officials. Interesting the self-employed and none, probably also self-employed. |
|
|
Marital status Married Single Widowed |
Percent 55.4 34.2 10.4 |
This is very similar to the PERSAL data, see next section |
|
|
Monthly salary income class 1000-2000 2000 - 3000 3000 - 4000 4000 - 5000 >5000 |
Percent 26.9 14.0 23.3 23.8 4.7 |
Note that the 2000 to 8000 category is represented by approx 2m people in SA and this is the category with the highest incidence of loans overall, estimated potential of R18b market |
|
|
Other monthly income 0 1-200 201-500 501-800 801-1000 >1000 |
Percent 53.4 12.4 14.0 8.8 7.3 4.1 |
This could indicate a second job or small business activities. What it does indicate is that we often judge loans as a percentage of income only based on salary income as we will do in the next section on PERSAL |
|
|
Information available on expenditure |
Covering |
School, groceries, transport, clothing, loans |
|
Table 13: Overview of clients financial transactions
|
Monthly loan repayments 0 1-200 201-400 401-600 601-800 801-1000 1001-1300 >1300 |
Percent 14.0 32.1 16.1 18.1 15.5 2.1 1.6 0.5 |
|
|
What interest do you pay? |
Only 8.8% could state an interest rate |
|
|
Purpose of loan Instalments School fees Household needs Agriculture Small business |
Percent 27.8 38.9 22.2 5.6 5.6 |
Instalments refer to loans to pay other loans, 11.6% go to enterprise finance |
|
Source of loan Businessman (trader) Money lender Stokvel Burial Society Family & Friends |
Percent 12.4 43.0 8.8 9.8 25.9 |
|
|
Why the specific source Only option Convenience Low interest rate Know each other No interest rate Other or no reason |
Percent 25.0 44.7 0.5 8.9 16.1 4.2 |
25% could be emergency or people who have exhausted other sources |
|
Loan amounts |
Percent |
Majority below 1000 |
|
Repayment period |
Majority below 3 months |
|
|
Last loan |
72.5 within the last year |
4.4.3 Analysis of information from PERSAL
The PERSAL system started capturing microloan details three years ago. As the system was designed merely to track salary changes and deductions it is not designed as a loan repayment tracking programme. Thus, no data exist on the system for interest rates and original capital sums and other detail loan information. However, the information from the PERSAL system does paint a picture on the profile of lenders and raise questions that could be addressed by affecting changes to the PERSAL system that would put us in a position to monitor the borrowing of state employees and to ensure that exploitation (and bad decisions) are minimised.
We carried out analysis that is based on two sets of PERSAL data, namely data for July 1999 and data for February 2000. The July 1999 date provides a fair snapshot of the situation before the effect of the June exemption change could take place (the MFRC only started officially to operate in July). Thus the PERSAL data will tell us what happened in the market since July 1999 and what was the effect of the legislative announcements and regulatory body. Table 14 provide us with a summary of changes since July 1999.
Table 14: Evolution of microloans on the Persal system
|
Variable |
July 1999 |
Feb 2000 |
Change in % |
|
Number of people on the system |
976 098 |
1 011 213 |
4% |
|
Percentage of people with microloans |
44.7 |
49.2 |
10% |
|
Female percentage with microloans |
52.02 |
51.89 |
-0.2% |
|
Total monthly deductions |
540.09 |
1295.14 |
140% |
|
Gross salary |
4435.85 |
4418.91 |
-0.4% |
|
Net salary (after all deduct) |
1697.30 |
1411.96 |
-17% |
|
Avg. remaining balance of micro loans/borrower |
7516.59 |
11797.68 |
57% |
|
Avg. no of loans per employee with microloans |
2.0 |
2.17 |
8.5% |
In table 14 it is evident that the level of indebtedness of individuals with loans on the system increased by 57 percent Net salary decreased and gross salary stayed constant. The pressure on repayment ability is evident Table 15 indicates the slow creep in terms of the increase in number of loans per employee who borrows. This is cause for concern. The very brief analysis reflected in these two tables is but a glimpse of what Is possible based on a thorough analysis of the PERSAL data. It can therefore serve as a good barometer of client profile in the market since Persal based loans are the easiest to make for term lenders, trends in the database can also serve as a forecaster of trends to come among private sector employees.
Table 15: Number of loans per person that borrowed in persons and in %
|
Number of loans |
July 1999 |
Feb 2000 |
||
|
N |
436421 |
% |
497328 |
% |
|
01 |
199972 |
45.82 |
201562 |
40.53 |
|
02 |
118285 |
27.10 |
135458 |
27.24 |
|
03 |
65659 |
15.04 |
84250 |
16.94 |
|
04 |
31966 |
7.32 |
44679 |
8.98 |
|
05 |
13458 |
3.08 |
20042 |
4.03 |
|
06 |
4885 |
1.12 |
7773 |
1.56 |
|
07 |
1611 |
0.37 |
2598 |
0.52 |
|
08 |
453 |
0.10 |
721 |
0.14 |
|
09 |
108 |
0.02 |
185 |
0.04 |
|
10+ |
24 |
0.00 |
60 |
0.01 |
| 4.5 | Cost of lending based on submitted information by lender groups |
During the court case in November a study of 47 microlenders (members of the MLA) was used to illustrate the impact of credit ceilings on the viability of these institutions. During our study both the MLA and the SAML submitted studies indicating profitability calculations. These are reflected here and discussed relative to the results of our analysis of MFRC supplied information.
4.5.1 Cost components of the MLA 47 study
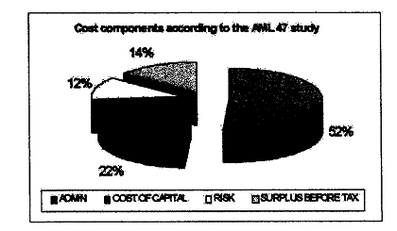
Figure 13: Cost components of the MLA 47 study
4.5.2 MLA - recent information submitted
The MLA also provided detailed information based on their analysis of 143 outlets studied and submitted for the first time through this study. A summary table provides the information. They do not provide information as to the representativeness of this sample. Offices are spread through out the country with the emphasis on Gauteng, Free State and Mpumalanga. Offices are also evenly spread between rural and urban (depending on their definition of rural). All of the clients are consistent wage earners which implies that the rural referred to here would be larger rural towns where there will be a high incidence of wage earners. It is also clear that most offices are small since 95 percent of the offices have outstanding balances of less than R300 000.
Table 16: Distribution of microlenders office by region, location and size
|
Region |
Location of Office |
Size |
|||
|
Number |
Number |
Number |
R'000 |
||
|
6 |
KwaZulu-Natal |
42 |
Central Business District |
73 |
-100 |
|
8 |
Northern Cape |
4 |
Urban |
52 |
-200 |
|
8 |
Northern Province |
10 |
Industrial area |
13 |
-300 |
|
11 |
Eastern Cape |
16 |
Economic Development Area |
3 |
-400 |
|
25 |
Mpumalanga |
14 |
Rural Large |
2 |
-400+ |
|
25 |
Free State |
33 |
Rural Medium |
||
|
22 |
Gauteng North |
20 |
Rural Small |
||
|
13 |
Gauteng South |
4 |
Mining Industry |
. |
|
|
7 |
Western Cape |
||||
|
18 |
North West |
||||
|
143 |
143 |
143 |
|||
The majority of clients of the MLA is male (71%). Approximately 60 percent of their clients fall in the age group between 30 and 50 years. Clients receive their salary mostly on a monthly basis (87%) and thus repaid mostly on a monthly basis.
Table 17: Average monthly salary of borrowers in MLA sample
|
Monthly salary in R |
<500 |
501 - 1000 |
1001 - 2000 |
2001 - 3000 |
3001 - 4000 |
4001 - 5000 |
>5000 |
|
% of clients |
11.8 |
27.7 |
41.2 |
12.3 |
3.7 |
1.4 |
1.9 |
The highest incidence of salaries received is in the below R2000 per month range.
Table 18: Number of offices, loan volume per office, average loan size, average number of clients per office and net client gain per month for all 143 offices
|
Number |
Loan Volume (R) |
Average Loan Size (R) |
Average number of clients |
Net gain |
|
|
73 |
0 - 100 000 |
550 |
513 |
-438 |
|
|
52 |
100 001 - 200 000 |
635 |
818 |
36.4 |
|
|
13 |
200 001-300 000 |
717 |
1361 |
195 |
|
|
3 |
300 001 - 400 000 |
690 |
1364 |
18.6 |
|
|
2 |
400 001+ |
649 |
2503 |
169.6 |
|
|
143 |
|
601 |
747 |
-18.4 |
|
The figures quoted here represent the results of an analysis of 143 offices of one microlender, the AMSA, a founder member of the MIA. The MLA has 1200 microlender members. The typical profile of a MIA client is a 30-day lender (what we refer to as the cash lenders). The MLA argues that the industry is subject to fierce competition and that clients have wide ranges of choices. They see their target market as those individuals with lower incomes and urgent short-term cash needs with a high-risk profile. More specifically, members of this target market do not have any collateral available as security.
They found that clients mostly borrow for education, housing costs, small business costs and emergency situations. They note a tremendous lack of insight in their target market about money matters and knowledge of financial management Overall the number of clients in the cash lender market is declining (as depicted by the analysis of this sample of 143 offices). These offices lose in total 18 clients per month, indicating that their market stabilised and started a slight decline in numbers. However, loan sizes increased slightly as well. It is also clear that the smaller offices (in terms of number of clients) are experiencing extreme pressures on their margins. These offices are in the medium and smaller rural towns, in the mining areas and urban areas[15], thus in the areas serving on the average poorer people.
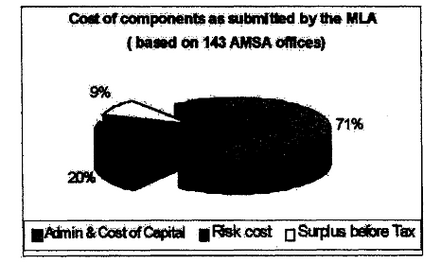
Figure 14: Cost of components as submitted by the MLA
The MLA did not provide detailed enough information to split the cost of capital from the administration cost. There is however no reason to believe that this will fail outside the proportions calculated earlier.
4.5.3 Analysis of information submitted by SAM
The South African Microlenders Association also submitted a detailed report to the shady. They emphasise the fact that they are cash Lenders (less than 35 day tent) and that they have a profile uniquely different from the rest of the market (the longer-term lenders). They argue that the Card and Pin arguments have been taken out of context and that their competition in the market uses it to take their clients and put them in a bad light They further argue that all these negative sentiments increased the cost of capital and made it increasingly difficult to finance their operations. They illustrated the difference between themselves and banks on the basis of a number of issues, including the size of loans and the profile of clients and especially between the practise of the banks to split fee end interest charges while theirs is an alt inclusive charge.
They provided information on the breakdown of costs and income figures for four different branch sizes. We calculated the cost of components as for the other organisations. This is depicted in the next graph. It is clear that their cost of capital is higher than for the rest of the cash lender market It may be that this information is derived from the Keynes group which may imply higher cost of capital since they source their capital through the stock exchange. We also calculated the impact of MFRC registration costs on the different branch sizes and the smaller branches are loosing 3 percentage points of profit while the bigger branches only looses one percentage point This may put further pressure on the increase in size of branches and the closure of amalgamation of smaller branches.
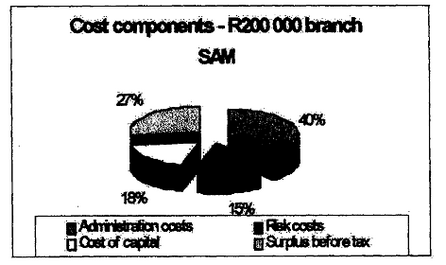
Figure 15: Cost of components - R200 000 branch
The cost components differ slightly between the analysis based on the MFRC information and the in-house analysis by the MLA and the SAM as shown in the next table.
Table 19: Comparison of short term cash lender cost components across samples.
|
Variable |
MFRC |
MLA 47 |
MLA |
SAM |
|
Administration |
63 |
52 |
71 |
40 |
|
Cost of capital |
9 |
22 |
- |
18 |
|
Risk component |
11 |
12 |
20 |
15 |
|
Surplus before tax |
17 |
14 |
9 |
27 |
The biggest differences are between the estimates of cost of capital and the risk cost estimate. These differences can be ascribed to the choice of institution and the timing of the data presented. However, overall it does not change the fact that cost of capital is indeed far smaller than the administrative costs associated with the lending activity. In all the analysis done in this study, based on a range of sources it has been clearly shown that administrative costs are indeed the biggest cost component (76,62,78,55 % of total expenses for the above institutions respectively).
| 4.6 | Interest rate ceilings and the consumer |
The one outstanding issue in this report pertains to the request to propose a specific interest rate at which the interest rate ceiling under the Usury Act should be set We have argued that we found no evidence of the positive effects of interest rate ceilings in our study of the available literature. We have further argued that liberalised markets improve competition that drives down costs and improve services to the consumer. In this side of the argument we have emphasised the role of the financiers.
But, what is the impact of credit rate ceilings on the borrowers, and especially the borrowers of small loans. Contrary to the best intentions of legislators; rate ceilings on bans- primarily instalment loans and mortgage loans - heap ‘distress’ on consumers in two general ways. First, some consumers are simply denied credit Second, having been denied credit these consumers resort to ‘second-best’ sources (else they would have used them in the first place). The following diagram illustrates the impact of rate ceilings on the availability of cash credit to high-risk consumers (the majority of individuals in the South African micro-finance market).
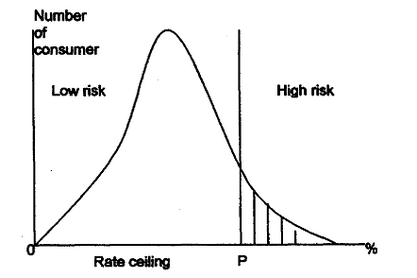
Figure 16: Impact of rate ceilings
Consumers are arranged along the horizontal axis according to the minimum percentage finance charge at which creditors would be willing to extend them a loan. A small number of tow-risk consumers comprise the left-most tail of the distribution of all consumers. Repayment risk associated with customers increases outward along the horizontal axis, driving up the minimum loan rate at which those customers could be served. The right hand tail of the distribution represents the highest risk customers in the distribution of all potential borrowers, those whom creditors would be willing to serve only at very high interest rates. Should the government impose an artificial cap on loan rates at P, all consumers to the right would be denied access to the legal market Why is this so? The higher the risk posed by credit applicants, the higher the costs to creditors of granting them credit A rate ceiling normally rations out the high-risk customers from the market and in addition it rations out customers seeking small loans. Why, since certain cost components (like administration costs) do not really change as the size of the loan decrease financial institutions have to charge higher rates on smatter loans to cover these components. Who are these customers in the South African context? They are those individuals who have limited assets that can serve as collateral, that have inadequate credit records on which to base decisions and that borrow typically small amounts.
The application of an effective interest rate ceiling below the current market rate of 30% in South Africa would most likely exclude at least 40 percent of the current clients from a sample of cash lenders investigated (based on information supplied by SAM). This calculation is based on the clients of branches that already are working on a tight margin under the current 30% interest rate due to a low volume of clients per branch. These branches are typically in the rural areas and the lower income peri-urban and outlying areas. Reduction of the interest rate below thirty percent would most likely lead to those outlets dosing.
| 4.7 | Assessment of risk and costing for risk |
Although it is quite straightforward to divide the risk of microlenders into categories it is quite difficult to attach a cost to each risk category. In this section we wilt state the different risk categories as discussed in section one and attach costs to these categories as far as possible. We differentiated between systemic risk and organisation specific risk.
Systemic risk refers to risk originating in the sector as a whole. Here we define the sector as the microfinance sector. However, due to trends of integration in the sector embodied in consolidation and purchasing of shares in microfinance institutions by the commercial banking sector and other actors in the financial sector the microfinance sector is integrated in the financial market and specifically also in the stock market. This implies that negative stock market movements may translate in downward pressure of those microfinance institutions listed on the stock exchange directly or indirectly on the share prices of controlling commercial banks. These in turn impacts on the capitalisation of the microfinance institutions and may increase demand for loan finance, exerting pressure on interest rates. A further point of importance is that if the stock market as a whole is negatively impacted on (as during the recent Asian financial crisis) it will also impact negatively on the levels of microfinance organisation share prices. It is possible to cost these risks by estimating the percentage decrease in share prices due to a range of influences and indicating the decrease in value of these shares. The following section illustrates the situation with respect to microfinance institutions listed on the stock exchange. It also illustrates the impact of perceptions and outside influences on the share prices of these institutions.
Five institutions listed on the JSE over the last four years with mixed results as indicated in table 20.
Table 20: Summary information on microlenders listed on the Johannesburg Stock Exchange
|
Company |
Date of listing |
Section of the Exchange |
List price (cents) |
Share price (cents) 22/10/99 |
|
Theta Group |
03/07/95 |
Banks & Financial Services |
25 |
1180 |
|
Zeltis Holdings |
17/08/98 |
Development Capital |
100 |
23 |
|
Money Wise Holdings |
02/12/98 |
Development Capital |
100 |
16 |
|
ABC Cash Plus |
18/02/99 |
Venture Capital |
100 |
25 |
|
Thuthukani Group |
04/03/99 |
Banks & Financial Services |
100 |
37 |
It is clear from table 20 that most of the recent listings have experienced a considerable decline in share prices. The Theta group however has shown consistent growth and is also the biggest group listed. Experience also shows that investors prefer investing in these institutions once they have built a track record, thus once they have more information on which to base investment decisions. Small lending institutions are new phenomena and many consider the market as being saturated by these institutions. This also contributes to reticence in investing in these shares. An interesting occurrence is the interest of commercial banks as investors in these firms. As commercial banks have a limited direct involvement in the microfinance sector they consider the JSE listings as an alternative to getting involved in the industry by acquiring significant shares in these newly listed companies. This approach to participation has various advantages for commercial banks, additional to sharing in a very lucrative market. They are able to withdraw quickly from this investment should they wish to, which greatly reduces their risk in a high-risk business. A further advantage is that the commercial banks can be represented on the board of directors, without the need to develop the expertise of directly managing this type of business, something in which those that have tried have largely failed (Baydas et at, 1997).
When analysing the degree of success of the newly listed companies it is important to take into account the fact that with the exception of Theta, none of the five listed micro lending industry companies were listed on the main board of the JSE. The significance of these sub board listings became very evident over the last 12 months with the turmoil in financial markets in developing countries, and specifically in South Africa. Since these sub-boards are high-risk investments, they were all sold of rapidly during the international financial crisis of 1998199.
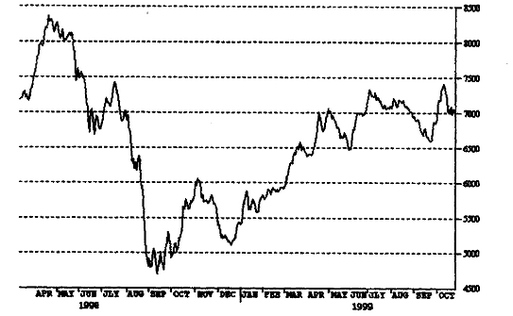
The South African stock market has an emerging market classification, which further contributed to a downward trend for share prices. Although the South African market has started recovery (see figure 1), the JSE like most other emerging markets lags the developed economy countries of which most has already surpassed their highs of 1998 and are constantly improving. During the recovery of the last few months microfinance shares did not retrace lost ground. This was mainly due to the fact that those foreign and local investors that did return to return to the market demanded high quality low risk investments, which excluded the micro lending companies with the exception of Theta. Investors are interested in those shares with above average earnings growth over a period of a couple of years, for it is inevitably a sign of good management, and arguably might lack for some of the more recent listings.
The small loans industry also suffer from the negative perceptions created (partly by members of the industry) in terms of exploitation which resulted in uncertainty that is definitely not conducive to building investor confidence about the industry. It is this factor which is mostly responsible for the continuous downward slump in the relevant share prices since December 1998.
Figure 17: Overall index of the Johannesburg Stock Exchange 1997 to 1999
The negative perception that tainted this industry is nothing new and one of the main reasons why the current study is in process. The implementation dates for the announced interventions (in 1999) were quite short and as could be expected the high degree of criticisms and uncertainty quickly converted Into a negative perception of this industry amongst the participants of the various financial markets, and the investing public at large. In line with investor behaviour this quickly resulted in these companies’ share prices being negatively influenced on the Johannesburg Stock Exchange.
Another high systemic risk area is the probability of the collapse of a large portion of the market through over-indebtedness. As we indicated in the earlier discussions there are marked trends in terms of an increase in outstanding loan size per client, an increase in length of low term per client, an increase in number of loans per client and not a commensurate increase in repayment ability per client This is evident of a loan spiral and the first signs are showing as illustrated by an analysis of some of the PERSAL data as depicted in figure 19.

Figure 18: Trends in arrears
It is clear from the diagram that the number of loans per employee increased in the eight-month period up to February 2000. The average number of loans per employee increased from 2 to 2.17 over the same period. In addition the outstanding loan per employee who borrows increased. by almost 57%, a sure danger sign in terms of a sharp increase in the level of indebtedness.
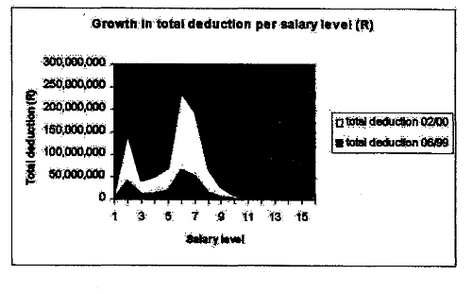
Figure 19: Growth in total deduction per salary level
A collapse of clients' repayment rate will impact severely on the microfinance industry. It will not only cause the collapse of the smaller term lenders (as this problem is mostly evident in the term lender market), it will also have a knock-on effect in terms of retrenchments of workers, impact on the share prices of the listed institutions and lastly on the larger financial institutions (the commercial banks). This will not bring the big commercial banks down, however, it will have major political backlashes and it will create very negative perceptions and sentiments regarding financial institutions. Thus it will increase unwillingness to invest in microfinance and that brings a concomitant increase in prices. How do we assess the price of this type of systemic risk? One way would be to assume that a certain percentage of clients (for example all of those with more than four loans on PERSAL - 62000 clients representing an outstanding loan amount of RI .2 billion) collapses. This can then be costed in terms of the impact on the term tender institutions. For example, it can imply that a third of the book of African Bank vanishes overnight, thus decreasing the value of African Bank’s asset side of the balance sheet by a third, or a total collapse of Unibank, or half of Saambou vanishing?
It is clear that the microfinance sector has reached the proportions where systemic risk is high and real. The loan situation cannot be evaded by legislation or capping rates, as that will not necessarily decrease existing tending. This calls for a different strategy and also a comprehensive strategy taking into account all facets of the market There wilt be more discussion about strategy in later sections.
Organisational risk stems from the clients or the internal operation of the organisation. In terms of the internal operation of the organisation risk is a function of the quality of management of the organisation. Quality of management (and governance) is embodied in the efficiency that is indicated by the growth and quality of the loan book of the microfinance organisation. An indication of the quality is the portfolio at risk (Balance of outstanding loans in arrears divided by the total outstanding bans). Quality of the book is also impacted on by the profitability or repayment ability of clients. Anything impacting on the repayment ability of clients is a risk factor and can be costed in terms of the lost growth in the size of the book and defaults in terms of repayments.
We also costed organisation specific risk in terms of the costs incurred to manage risk (before it takes place) or to cover risk (after it took place).
|
Risk management costs |
Risk coverage costs |
|
Insurance |
Bad debts write-off |
|
Bad debts provision |
Collection fees/Repossession fees |
|
Legal costs |
Fines |
|
Security costs |
Legal costs |
|
First Aid |
All of these costs were estimated for the different microlenders (term groups) and included in our estimates for the risk cost component.
Figure 20 depicts the situation with respect to trends in organizational specific risk in the South African commercial banks in terms of charges for bad or doubtful advances as a percentage of total advances (on an annual basis).
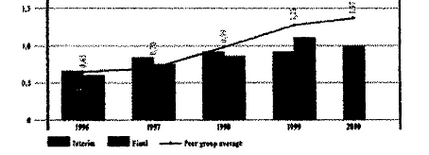
Figure 20: Charge for bad and doubtful advances as a % of advances for South African banks 1996 to 2000
The same trends apply for the microfinance sector. In the cash loan sector a study of 111 cash lenders indicated an increase in arrears from 0.04% of outstanding loans to 5% over the last year (March 1999 to April 2000).
[12] Ratio explained in detail at end of this section.
[13] Adding the cost of first registration for the MFRC to the administration costs of the cash lenders increase their administration costs by one percentage point and decreases their surplus before tax by one percentage point
[14] Note we work with assets of one year while the ratio for the commercial banks is based on average assets.
[15] Urban is not well defined, however, if central business district refers to the core urban, then urban probably refers to the outlying areas, or peri-urban areas.