 Protection of Businesses Act, 1978
R 385
Usury Act, 1968 (Act No. 73 of 1968)
Report on Costs and Interest Rates in the Small Loans Sector
|
| 2.1 | Introduction |
The market for credit is comprised of two main functions: the demand for and the supply of credit products. Historically there has always been a demand for credit that has resulted in someone supplying the service. As there is no way to separate the supply side from the demand side of the industry, they must be looked at together. Markets are dynamic; they can grow or shrink as different elements in the supply and demand functions evolve. The demand functions can change as consumers (buyers) become more sophisticated in the use of credit and as they understand the costs associated with borrowing or the benefits deriving from borrowing. The supply function can also evolve as the industry grows, becomes more sophisticated, develops new tools to lower costs associated with risk, develops new systems to lower administrative costs, and develops new ways of doing business.
This section will look at the elements that comprise both of those two key functions in the market for microcredit in South Africa. It will try to estimate the current level of demand for micro credit products in South Africa (expressed as the effective demand that is being currently serviced) and will also try to present an order of magnitude on the potential demand for credit. On the supply side, this chapter will look at the actual suppliers, and try to estimate the current level of supply in the country.
| 2.2 | A brief historical perspective |
Before 1992, there were few official options available to people wanting to access to small amounts of credit Banks were not offering microcredit, so the borrowers had to resort to pawnbrokers or operators in the informal sector the mashonisas or other informal systems such as the stokvels, burial societies and rotating savings and credit associations (ROSCAs).
As the rules governing, the provision of credit evolved in 1992, a whole new industry arose. Now that it was legal to extend loans at rates greater than those capped by the Usury Act, two separate programs began to expand their operations: independent cash loan operators making one month. loans and term lenders that were basing their repayments on payroll deductions.
Both segments grew significantly over the following 7 years with many of the fluctuations in the industry that could be expected in a highly dynamic growth industry. While there is very little official data collected on the sector, there have been a series of estimates published over the years, estimating the supply of microcredit to the South African market
The Notice issued in June 1999 has had a great impact on the industry. Since June, several trends have become apparent, even in this very short time:
| ❖ | Increasing formalisation of the industry (registration of previously independent operations into registered firms); |
| ❖ | Introduction of new actors (furniture traders and retail merchants) |
| ❖ | Increased interest of the commercial banking sector |
| ❖ | Increasing formal investment in microlending (funds raised on the stock market or through private placement). |
| ❖ | Increasing levels of client indebtedness. |
These will be reviewed further later in this chapter.
| 2.3 | Demand for microfinance products services |
The demand for banking services by the lower income strata of the population is growing rapidly, due to a variety of factors. These include current low frequency of use of the formal banking services by the poor and M&SE market, increased income of the lower income strata, income redistribution in favour of lower income people, urbanisation, rising consumer aspirations and the rapid growth of the informal business sector. In reaction a considerable growth is experienced in the microfinance sector, and the biggest source of growth is from the microlending sector. The formal banking sector seems inappropriately structured to satisfy this rapid growth in demand.
Financing is required for a wide variety of applications by small borrowers. The list below identifies some of them:
| ❖ | Seasonal fluctuation in cash flow |
| ❖ | Fund or start a small income generating activity |
| ❖ | Consolidate other loans (actually probably means pay off other loans, not so much consolidate them) |
| ❖ | Access other sources of capital |
| ❖ | Housing improvements |
| ❖ | Emergencies |
| ❖ | Education |
| ❖ | Purchase consumer products |
| ❖ | Fund bad habits, like drinking, etc. |
Provident Fund did a survey of its clients in South Africa, which revealed that 96 percent of their loans were used for productive activities with interest rates ranging between 109.99% and 277%.
A recent survey carried out by the University of Pretoria identified the following needs for microfinance in the peri-urban areas of Pietersburg in the Northern Province:
|
Installments: |
27.8% |
|
School Fees: |
38.9% |
|
Household Needs: |
22.2% |
|
Agriculture: |
5.6% |
|
Small Business: |
5.6% |
However less than 50 percent of the loans were sourced from moneylenders.
2.3.1 Potential Demand
Potential demand for microcredit refers to the maximum amount of demand that there could be for micro credit products in South Africa. In order to estimate the potential demand one could look at needs that require larger purchases. Alternatively, one could look at the current salary of the employees who are typically microlender clients and determine what level of indebtedness they could satisfactorily handle and the amount of credit that this would require.
Different estimates of the potential demand for microcredit exist One way would be to take the number of employed people in the LSM categories and estimate either 25% of their gross salary, which would provide the "safe" level of lending for the industry. This is safe in terms of over-indebtedness for the clients as well as in capacity to repay for the MFI.
Table 4: Living standard measurement categories
|
LSM |
Number (16+) |
% |
% |
Unemployed (%) |
Individual's Monthly Income |
Savings (%) |
Biggest Problem |
People in h/h |
|
1 |
3,738,000 |
15 |
59 |
80 |
320 |
4 |
Unemployment |
3.2 |
|
2 |
3,560,000 |
15 |
52 |
74 |
603 |
7 |
Unemployment |
3.0 |
|
3 |
4,294,000 |
18 |
54 |
72 |
801 |
7 |
Unemployment |
2.9 |
|
4 |
3,314,000 |
14 |
51 |
65 |
1048 |
8 |
Unemployment |
2.9 |
|
5 |
2,041,000 |
8 |
52 |
62 |
1421 |
8 |
Crime |
2.9 |
|
6 |
1,888,000 |
8 |
58 |
61 |
1653 |
6 |
Crime |
3.2 |
|
7 |
2,534,000 |
10 |
50 |
49 |
3686 |
5 |
Crime |
2.5 |
|
8 |
3,246,000 |
13 |
49 |
37 |
5660 |
5 |
Crime |
2,4 |
Assuming that 90 percent of the salaried individuals in the LSM 3,4,5, and 6 categories are the main clients for microlenders, with some additional demand coming from LSM 1 & 2 (50% of employed clients), LSM 7 (50% of earners) and a few from LSM 8 (10%) the total number of potential clients for the formal microlending sector is about 5.5 million wage earning individuals, with a gross salary of about R8.4 billion per month.
In the United States and other developed countries, bank standards for safe levels of indebtedness for the sum of all payments are pegged at 25 percent of gross salary. This amount includes both principal and interest Extrapolating out to South African conditions, the following table presents the maximum potential demand for microloans among salaried employees, depending on the interest rate being charged.
Table 5: Potential size of microloans to salaried employees
|
Monthly Effec. Interest Rate |
Percent of % loan to reach 25% |
Potential Size of Monthly Market |
Potential Size of Annual Market |
% of loan to reach 50% |
Potential Size of Monthly market |
Potential Size of Annual Market |
|
30% |
19.2% |
1,562,604,345 |
18,751,252,140 |
38.5% |
3,125,208,690 |
37,502,504,280 |
|
25% |
20.0% |
1,625,108,519 |
19,501,302,226 |
40.0% |
3,250,217,038 |
39,002,604,451 |
|
20% |
20.8% |
1,692,821,374 |
20,313,856,485 |
41.7% |
3,385,642,748 |
40,627,712,970 |
|
15% |
21.7% |
1,766,422,303 |
21,197,067,637 |
43.5% |
3,532,844,606 |
42,394,135,273 |
|
10% |
22.7% |
1,846,714,226 |
22,160,570,711 |
45.5% |
3,693,428,452 |
44,321,141,422 |
|
5% |
23.8% |
1,934,652,999 |
23,215,835,983 |
47.6% |
3,869,305,997 |
46,431,671,966 |
The conclusions from this table are that the potential safe size of the market is in the range of R18 to R23 billion per annum. At the much riskier levels, which are actually being practised in South Africa, this figure increases to R38 to R46 billion. Since these figures assume an even spread across the employees, with no employee borrowing more than a 25% repayment schedule would allow, the real "safe" size of the credit market would be substantially less. However we currently find that the expressed demand, see below, already surpasses the potential "safe" level of demand, indicating over indebtedness.
Another approach is to value the new housing expenditures. In March 1999 an Investment bank study [6] estimated the overall housing market, with a backlog of 4 million units, is R180 billion. Assuming that microlenders could supply 20 percent of this amount, the total potential microlending market is 36 billion. In the short term, they estimate that the housing market is 5.8 billion. However, this does not include funds that could go for housing improvements, which is reputedly the largest amount of the loans for the microlending industry.
2.3.2 Expressed or Effective Demand
Effective demand refers to the actual level of demand for credit services. This is usually a function of the cost of the services, availability of the services, and awareness of the services, in a market where supply exceeds demand, the effective demand can be simply expressed as the total supply that has been provided. In growth markets where, demand has surpassed the available supply or the capacity of the institutions to provide, current levels of supply may not necessarily reflect true demand.
At the end of this section we will review the current status of the market for micro loans, which is conservatively estimated at R13 billion in current outstanding portfolio, but is probably closer to R17 billion. On an annual turnover basis, the effective demand is for about R25 billion.
2.3.3 Consumer protection and education
There are very different levels of sophistication among the clients of the microlenders. The typical clients for microloans are relatively unsophisticated. A recent survey of rural borrowers revealed that only 8.9 percent of the borrowers knew the interest rate. By contrast, all of them knew the amount that they had to repay and the cash flow to do so. But in a very dynamic market, where capturing market share is very important for the financial institutions, there can be cases of abuse of the loan process by the lending institution or its agents.
Consumer protection has taken a strong step forward in the past eight months with the creation of the MFRC, which is designed to protect the interests of the consumer and to ensure that all Institutions and lenders abide by the regulations.
| 2.4 | Supply of Microfinance: Structure of the industry |
The modem microlending industry that we see in South Africa today, is a relatively recent phenomenon. It arose out of the Exemption to the Usury Act of 1992. There are many different types of individuals, and companies involved in microlending. Some are in the formal sector and many are in the informal sector. This section will break out the different types of lenders, identity their specific types of products and attempt to put values next to them.
2.4.1 Size and Evolution of the industry
The microlending industry has grown steadily in terms of value of loans outstanding over the past decade and continues to grow in aggregate as new, large players enter the market. At the same time, smaller, less efficient operators are closing their doors, consolidating, or dropping out of the formal market (into the informal, unregulated sector). So the numbers of operators in different segments is evolving in different ways. The new regulations promulgated in June 1999 have been an important factor in this evolution.
As noted above there are several different segments in the industry:
| ❖ | Formal registered firms, which include commercial banks, financial institutions, section 21 (not for profit) enterprise lenders, developmental lenders, and the larger short term money lenders; |
| ❖ | Semi-formal money lenders, which include small unregistered money lenders who are doing it as their main livelihood and the pawnbrokers, who are not formally included in the money lending statistics (yet); and |
| ❖ | Purely informal moneylenders such as the township moneylenders (mashonisas) and stokvels, burial societies, and ROSCAs. |
The most accurate information available is on the first group, banks and formally registered money-lending firms. However this data is just becoming formally available since the creation of the MFRC. There are estimates of the roles and scale of the other two groups, but this is done through extrapolation. The sections which follow below will review the findings from the formally registered firms (which comprise the vast majority of the overall volume of transactions in the market), followed by the estimates from the semi-formal and informal financial service providers.
2.4.2 The Lenders
A wide range of firms has developed over the past 8 years to supply microfinance to the population in South Africa. The table below breaks out the formal lenders by legal category as they are registered with the MFRC.
Table 6: Formal lenders by legal category
|
Type of Institution |
Number of Registered Firms |
Number of Certificates |
Outstanding Book |
Number of Debtors |
|
Section 21 |
7 |
43 |
29,224,477 |
48214 |
|
Private Company |
122 |
1960 |
1,202,456,352 |
558961 |
|
Closed Corporation |
597 |
1025 |
191,864,981 |
270488 |
|
Bank |
7 |
355 |
3,352,586,312 |
1389813 |
|
Public Company |
8 |
284 |
302,465,465 |
224218 |
|
Trust |
47 |
110 |
61,175,040 |
41164 |
|
Natural Person |
58 |
72 |
8,874,228 |
16167 |
|
Mutual Bank |
2 |
8 |
116,403,082 |
14604 |
|
Co-operative |
4 |
16 |
66,010,133 |
31137 |
|
Total Registered |
852 |
3,873 |
5,331,080,070 |
2,594,766 |
|
Source, MFRC data collected as of February, 2000 |
||||
The data above does not include those institutions that have not been registered by the MFRC. Estimates from the Credit bureau indicate that there has been a significant drop in the number of storefronts officially serving as cash lenders over the past two years. Their studies estimated 6,000 storefronts two years ago, between 3,500 and 4000 storefronts in early 2000. and project an additional drop in storefronts to about 2,500 by the end of 2000. However, while the number of storefronts has decreased, the number of clients has remained constant or increased.
The next table presents estimated numbers of the informal lenders in the country. These figures are estimates drawn from other sources, such as associations and other research documents.
Table 7: Estimated totals for South Africa
|
Lenders |
Outstanding Book |
No. of Clients |
|
|
Mashonisas |
25,000 |
150,000,000 |
500,000 |
|
Pawnbrokers |
5,000 |
300,000,000 |
100,000 |
|
Stokvel/ROSCA |
800,000 |
240,000,000 |
8,000,000 |
|
Sources: Du Plessis, Assn. Of Pawn Brokers, NASASA |
|||
These different lenders can be regrouped into different categories based on the type of lending that they are involved in. The first four are focused on "consumption" lending and lend only to customers with bank accounts and regular salaries. The other lenders, either developmental or enterprise lenders, generally base their repayments on cash flow from the productive activity. The source of repayment is the main differentiating factor between the two groups of lenders.
Short Term Cash Lender
The short term cash lender focuses on loans up to 32 days, or the next pay period. On average, these lenders charge an interest rate of 30 percent per month, all fees included. They are the largest number of individual institutions, but each branch tends to be relatively small in size, with loan book of between R50,000 and R500,000. There are some large companies, like the Keynes group, which has more than 120 branches and 18 million that concentrate exclusively on this market. The 30-day cash lenders have historically been users of the bankcard and pin for security. Their target market is clients with a net income of up to R2,000 per month. The average loan for these firms is about R500, as it takes into very strict consideration the capacity of the borrower to repay at the end of the month. Capital resources come mainly from their own sources, and occasionally from illegal loans from friends (illegal because this is not allowed under South African law). Only a few of the largest companies (like Keynes) have legally raised outside sources of funds.
It is important to note that the rate charged by 30 day cash lenders applies to all loans less than that period or which are repaid on a weekly basis. This raises the effective interest rate of the loan. Very important to note that even with the bank cards and pin numbers, the default rate on loans was in the neighbourhood of 2.5 - 5 percent. Now that the use of bank cards and pin numbers have been eliminated, this rate has tended to double among the lenders.
Medium Term Cash Lenders
There is often a fair amount of overlap between firms that are lending between one and six months and the term lenders. They have a mix of products that are in majority 30-day loans, but also a range of slightly longer term bans reserved for their better clients. Average loans in the 1-6 month category can increase to a multiple of the person’s actual net take home pay, as they have more time to pay it off. Historically, these lenders have also used the bank card with pin number as the repayment mechanism. With the restriction of the use of the bank card, many of these lenders are experimenting with other forms of collection.
Interest rates will vary by the term of the loan, but are usually discussed as a flat rate on a declining balance, which effectively increases the effective rate. The nominal interest rate may be between 30 percent (for 30 days) and 12.5 percent (per month for the period), but the effective interest rate is always greater than 20 percent per month. Because these loans are made to better known clients, the default rate is generally lower, about 2.5 percent without the bank card.
Since the short term cash lenders and the medium term cash lenders are often lumped together into the same category, since branches often do both, it Is difficult to differentiate between them. Overall, the estimates from the credit bureaux specialising in cash borrowers, are that there are now roughly 3,500 - 4,000 storefronts in the country. This figure is down from an estimated 6,000 storefronts two years ago, and is expected to continue decreasing this year to a ceiling of 2,500 storefronts by the end of the year.[7]
Term Lenders
The term lenders make loans for periods between six months and 36 months. The industry started through the use of Persal, the government's central payroll system, using debit orders to get repayment at the source, before the borrower actually had a chance to see the money. Now that these lenders are saturating the market, they are branching out to the larger private companies to establish credit service relationships with them. This is the most rapidly growing segment of the industry, but which has often been restricted by cash to lend. The commercial banks are becoming increasingly involved in this segment of the market, buying up the large term microlenders to develop their access to the market, while reducing the financial constraints on their lending partners.
Housing Lenders
Housing lenders are closely associated with the term lenders. Most longer term mortgage loans are greater than the ceiling set for microloans and fall outside of the exemption. But there are a lot of microloans made in the name of housing, as it is the basis of access to a Persal code, which greatly facilitates repayment Housing loans can also be secured by provident funds, effectively bringing the risk to near zero. Large banks are involved in housing finance, as well as small specialised lending boutiques. The National Housing Finance Corporation (NHFC) has a number of programmes to assist retail lenders to access finance to on-lend to borrowers for housing improvement
The NHFC promotes both urban housing as well as rural housing. Lenders in the housing industry include microlenders, small banks, social housing programmes, and non-bank financial institutions (NBFI) such as NGOs. Methods of securitisation include: none (unsecured), provident fund, payroll, and mortgages. The Rural Housing Loan Fund (RHLF) programme works with microlenders doing housing in the rural areas with unsecured bans, for which interest rates of 40 percent (on a declining balance) are common. For provident backed loans, margins above the cost of money are typically between four and five percent
Furniture/Retail Lenders
The furniture and retail store lenders are the latest entrants to the market, primarily arriving since the creation of the MFRC. The furniture industry is already a R15 billion industry per year in South Africa, with about RIO billion of that being sold on credit. Historically, furniture sales have been made under the Credit Agreements Act, which restricted interest rates to the ceiling of the usury act, while allowing the seller to retain ownership of the goods sold as collateral. However with the advent of the MFRC and a clearer more transparent regulatory environment for microlending, many of the Furniture lenders, as well as other retail stores such as Woolworths and J&D, have also entered the market They have registered branches as microlenders and are actively promoting microloans to their regular, well known clients. These lenders have a solid credit history on their clients and rely on a credit scoring methodology to assess risk and do not require debit orders or other deductions at the source. Most of their clients are salaried employees, however.
This is still a very new segment of the microlending market and has not yet started to develop. It is expected that it will replace a lot of the furniture credit market as well as making additional small loans to their customers.
The MFRC has placed many objections to furniture lenders entering the microlending market, as they see it as a means of bypassing ceilings under the Credit Agreement Act.
The argument is that since they also control the price of the items they are selling, the lender can adjust the price of the goods to cover the cost of the lending. However, the furniture lenders say that the ceiling on the credit Agreement Act does not allow them to fully recover their costs.
Enterprise Lenders
Microenterprise lenders are a special group in the micro credit industry. Around the world, microfinance is associated with enterprise development finance, though in South Africa, microenterprise finance accounts for a very small portion of the microcredit market Though some "consumption" lending may go towards financing productive activities, Microenterprise finance comes largely from NGOs and Trusts. There is very little overt microenterprise finance from the commercial banking sector in South Africa, which has put a floor of R50,000 on enterprise lending. Khula is the major financier of enterprise finance and reports that there was RIO8 million outstanding among about 26 lenders, accounting for loans to 66,000 microenterprises. This is a tiny portion of the entire industry. Average loan sizes among the microenterprise lenders are generally in the R3-6,000 range.
Enterprise lenders are generally new institutions that have had to invest in all of their systems, and are restricted just to lending. By and large microenterprise lenders are still in their growth phase and are still investing in their operations. Estimates submitted by the Micro Enterprise Alliance (MEA) and verified by the team show that an effective rate of 72 percent would be a minimum to cover a steady state microlending operation in South Africa that had already achieved sustainability. Since most micro enterprise lenders are still in growth phases, and even after they reach sustainability will have to continue to grow, the 72 percent figure is well below, the limit for sustained growth and development.
Developmental Lenders
The developmental lenders are increasingly similar in their approaches to the enterprise lenders, except that they have a far greater existing investment and base to build from. Some have savings as a resource (like Ithala) and others have institutional investors, which provides them with cheaper access to capital. Some of the largest lenders include Land Bank (which now has a microlending portfolio of 41,000 clients, but an outstanding book of only about RIO million), Ithala, and the Eastern Cape Banks.
Township Ienders/Mashonisas
The mashonisas are the informal sector lenders who operate completely outside of the formal sector. When there was no other alternative for borrowers, the mashonisas were their solution. The mashonisas specialise in short term loans, generally for 30 days.
Interest rates run in the range of 50 percent per month, though no additional interest is charged if the borrower is late, effectively reducing the cost of lending. Mashonisas are often woman with no other means of support who try to earn a living wage out of this job.
They will often have 15-20 clients, borrowing an average of R150-250 at a time, so individually, they are extremely small players. However, there are many of them, estimated at between 25,000 and 30,000 around the country. Monthly earnings by a mashonisa are often quite small, in absolute terms, in the range of R2-3,000 per month. Interestingly enough, it appears that most mashonisas are very close to their clients and the clients are loyal to them. The borrowers’ survey, referenced below, demonstrates that most clients of mashonisas look to make sure that they can afford the repayment stream before starting their payments.
Pawnbrokers
Pawnbrokers comprise one of the oldest industries in South Africa. Pawnbrokers use durable and semi durable goods as collateral against money that they advance to individuals in need of short term (generally less than 30 days) funds. These are often used to finance emergencies, or short term cash flow deficiencies in their daily lives and businesses. The advances are made against the pledged item(s) at a rate of 25-30 percent per month, and the borrower has up to three months to reclaim his items by paying off the advance, or else he forfeits the items that he has pledged. Between the time the pawnbroker has made the advance until the time the client comes to reclaim the item, the pawnbroker must store and maintain the Item in original condition. If the client forfeits the item, the item then belongs to the pawnbroker and he is free to sell it as a second hand good. Roughly 35 percent of all pawned items are not paid off and collected.
While there is much debate about the value that is applied to the items that are pawned compared to their real value, the pawnbroker must incur many costs. The pawnbroker must appraise the item, transport it to his shop, store it for up to three months (with the opportunity cost of capital), and, if the item is not collected proceed with the sale, which could take several months depending on the demand for the item.
There are roughly 5000 pawnbrokers in South Africa, according to the Association of Pawnbrokers, which officially represents 1500 of them. Pawnbrokers are registered under the Second Hand Goods Act, so are already regulated and pay VAT on all transactions. The cost structure for pawnbrokers differs radically from the cost structure for microlenders, due to their primary operation of storing and selling the second hand goods.
Stokvels
In this instance, we use Stokvels to refer to the various informal financial institutions that capture member savings and then either save them or on-lend them to some of the members of the groups on a rotating basis. These include the Stokvels, properly stated, burial societies, and rotating savings and credit associations (ROSCA’s). According to NASASA, the association of Stokvels, there are an estimated 800,000 such institutions comprising about 8.25 million adults accounting for about R200 million a month in savings. They are governed under the Banks Act under the Stokvel exemption. This allows for stokvels, as member based organisations providing services just to their members, that are members of the NASASA to be regulated by NASASA. Only 15,000 groups are officially registered with NASASA, but in actuality, all Stokvels are only providing services to their own members, this is considered to be safe.
In terms of calculating costs associated with lending, there are very few. Management of the associations is voluntary, and most of the funds are normally distributed to members at the time of the group meeting and deposit of funds. Since all repayments, with whatever interest, if any, go back into the group fund for redistribution to the members, the interest rates serve more as mechanisms for forced savings for the members.
Supply by Officially Registered firms
Among the officially registered firms, one can differentiate several different types of suppliers which have different attributes and which use different means to collect repayments. One important category are those who specialise in payroll deduction. which allow for deduction of payments at the source, before the employee actually sees the money. The largest payroll is from the government, through the SITA system, which provides access codes to a limited number of financial institutions, currently fixed at 143. These privileged institutions have access to more than one million clients. This section will first look at the overall market, with statistics derived from data collected by the MFRC and will then focus in on the suppliers of service by the Persal registered firms.
The statistics presented below were captured by the MFRC in raw form and were extrapolated by the consultants based on the information reported to the MFRC by their registered firms. It is important to note that the data was collected over a period from July to January, representing the statistics in the firm at the time that the firm registered with the MFRC. As the MFRC passes its first full year of operations and firms register for the second time, it will be able to capture much more accurate data that can be more appropriately extrapolated and analysed.
While there are certainly many errors in the data collected by the MFRC, these statistics are the best ones that are formally available. The bulk of the analysis is carried out on the statistics from those firms that have been registered by the MFRC, excluding those that have not been registered, because this data is considered to be the cleanest data. lt also represents the greatest level of volume in the industry (current loans outstanding). These figures must be recognised for what they are, extrapolations based on firm level data, but they should depict a fairly accurate overall picture of the structure of the microlending industry from statistics provided at the time of registration by the microlenders. If we consider all the firms that have been registered by the MFRC (see Annexe 3 for a detailed overview) it is clear that the greatest number of these firms are closed corporations (CC), but they represent the smallest book by individual operation and the smallest number of average branches per firm. At the other end of the spectrum are the banks, with only seven of them registered, they account for the greatest outstanding book and the largest average number of branches per bank.
The real dark horse in these figures is the private companies. Some of them are simply individual money lenders, but others are large corporations involved in other retail operations that have entered the microlending industry since the creation of the MFRC.
Two of the private companies account for 1057 branches, over one half of the registered branches in their category (and 25% overall). However, these lenders have only made a total of R1.8 million in loans. When they start lending full bore, it is anticipated that the number of loans and the value will increase tremendously.
Comparison between registered firms and those that have not yet been registered
The data collected by the MFRC indicates that there are a large number of firms (about 400) that have applied, but have not been registered for a variety of reasons. These usually included incomplete applications, not having a legal registration, or missing important pieces of information, either financial statements or incomplete information on clients. The main differences will certainly be among the smallest lenders, where the least accurate data is presented.
The statistics from the MFRC show that most of the firms that have applied but have not yet been registered are in the 30 day money lenders and the 1-6 month lenders. It appears from the stats that the total client base, according to the registration statistics, is more than 1.1 million for the 30-day lenders, an increase of nearly 700,000 clients (150%) over those that have been officially registered. The next biggest gap is in the 1-6 month category of lenders, where there are an additional 250,000 clients (an additional 100%) listed with an extra R200 million in outstanding book.
Distribution of the outstanding book, by term
Total outstanding book for registered lenders was estimated at R5.3 billion. When one looks at the distribution of loans that are currently outstanding, the longer term lenders dominate the market for microfinance with 64 percent of the total outstanding book, or about 3.4 billion Rand. Those term lenders with a shorter time horizon of six to twelve months account for about 16 percent of the total book, while the short term cash lenders only account for about 8 percent of the book
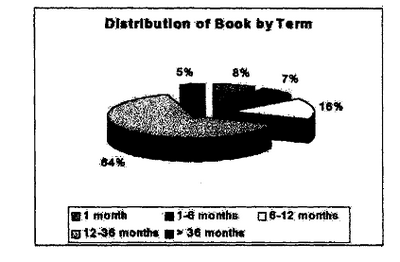
Figure 1: Distribution of Book by Term
Annual turnover
However, when one contrasts this with the overall annual turnover in the industry, the picture changes somewhat Making assumptions that loans with a term of one month actually turn over 12 times in a year, and that a 36 month loan only turns over once every three years, we are able to make the following estimates on the level of formally regulated lending.Total turnover among the registered firms increases to 9.7 billion Rand, of which 53 percent comes from the 30 day cash lenders and only 11 percent come from the main term lenders (12-36 months).
Annual turnover
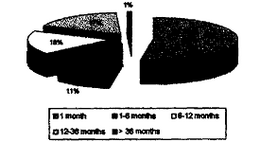
Figure 2 : Annual Turnover
When one adjusts these figures to include the number of MFI that are not included in the registered firms, the importance of the short term money increases even more, as noted above. This can have an important effect on all of the other averages and figures that are presented below.
Clients by loan term
We have the same issues with distribution of clients by term over the course of the year that one finds with the volume of loans outstanding. Looking at the total number of loans outstanding by size, it is clear that only a small fraction of the clients of the registered lenders are in the 30 day category (17%), while a much larger percentage is in the 12-36 month category (52%).
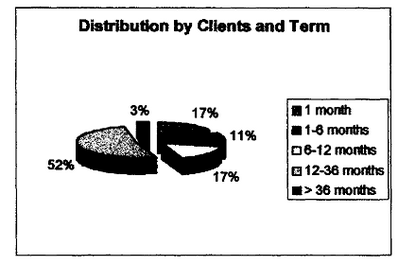
Figure 3: Distribution by Clients and Term
However when one annualises the numbers of clients receiving loans over the course of the year, it is clear that there are far more transactions at the 30 day lender level (68%of all transactions) than there are at the 12-38 month level (9% of all transactions).
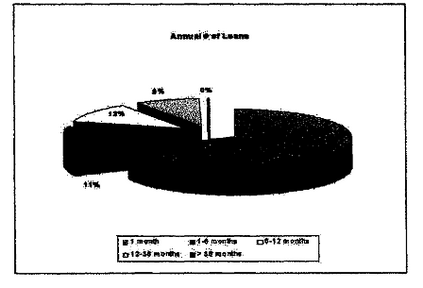
Figure 4: Annual number of Loans
Clients by loan size
As with the earlier analyses, the term of the loan plays a very important role in the analysis of the number of clients by loan sin Since the short term lenders only make loans below RI ,000, their clients are concentrated there (21% of the outstanding client base), with the vast majority failing into the 1000 - 6,000 loan size. This latter group is handled by the term lenders, who rarely lend below R2,000. Relatively few clients thus far had been registered in the above R6,000 loan size, since that had been the former ceiling on exemption. It is anticipated that this amount will increase greatly through new loans.
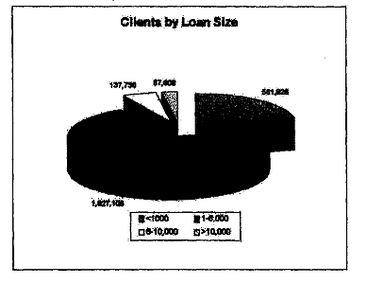
Figure 5: Clients by Loan Size
Periods of Repayment
The vast majority of the registered firms collect loans on a monthly basis (96.4 percent of all clients). While there are a few fortnightly collections, 2.7 percent of the clients serviced by lenders said that they collect on a weekly basis. The roughly 3.5 percent of clients who repay on a weekly or fortnightly basis pay substantially higher rates of interest (effective rate above 624 percent).
Another key group of lenders includes the furniture traders and other retail outlet companies that are getting into microlending. As of their registration, they included just a limited number of clients, but this is certain to grow. As noted above, with more than a thousand outlets, the two largest should be handling close to a million clients alone within a few years.
2.4.3 Supply from Other Key Microloan providers
In addition to the formally registered lenders that have been captured above, there are a great number of other Institutions and individuals that are participating in microlending. In order to get a perspective on the size of their industry, we will develop the size of their market.
Township lenders/mashonisas
The best estimates on the number of Township moneylenders is approximately 30,000.
This is the figure that has been developed by Du Plessis and is most commonly referred to by researchers. The research by Jimmy Roth on Township moneylenders in the Grahamstown area can be taken as a proxy for the average lender. This was confirmed by a recent survey in the North, which found similar statistics. The typical lender has about 15-20 clients with a total outstanding book of about R5,000. Therefore, using this as a proxy, the township lenders account for about 600,000 clients on a monthly basis, equal to the number from the formal moneylenders, but their outstanding book is significantly smaller, about R150 million. On an annual basis this comes out to R1.8 billion.
Pawnbrokers and Second Hand Dealers
The estimates for pawnbrokers vary. Different reports on pawnbrokers in South Africa from the association of pawnbrokers put the number at about 3000 full time pawnbrokers and an additional 2,000 part time pawnbrokers. Legally they are governed under the Act on Second Hand Goods. Most loans are for one month or less. Estimating that the average portfolio outstanding is about R 60,000 per pawnbroker, there is an outstanding monthly balance of about R300 million. Taking an average term of one month (which may be too long), there is an annual turnover of R3.6 billion
Stokvels/Burial Societies/ROSCAs
The association of Stokvels (NASASA) estimates that there are 8 million individuals who are members of about 800,000 of these informal groups that provide loans to their members from own resources[8]. Interest rates may or may not be charged depending on the group and its operating procedures. Legally, they are governed under the Banks Act as a self regulating organisation. Taking an estimate of R25 per member per month, there is a monthly contribution of about R200 million into the systems of which an important part is loaned back out to the members. This comes to a total annual turnover of R2.4 bn.
2.4.4 Summary table of the entire industry
Table 8: Summary table of the entire industry
|
No. of branches |
Current Portfolio |
Value of Loans Written / yr |
|
|
Cash Lenders |
4,000 |
1,300,000,000 |
12,000,000,000 |
|
Term Lenders, payroll |
500 |
4,500,000,000 |
2,250,000,000 |
|
Term Lenders, no payroll |
1,200 |
1,200,000,000 |
1,200,000,000 |
|
Total Registered Lenders |
5,700 |
7,000,000,000 |
15,450,000,000 |
|
Pawn Brokers |
5,000 |
300,000,000 |
3,600,000,000 |
|
Mashonisas |
25,000 |
150,000,000 |
1,800,000,000 |
|
Stokvels, B.S., KC. |
800,000 |
250,000,000 |
2,500,000,000 |
|
Total Informal Sector |
830,000 |
700,000,000 |
7,900,000,000 |
|
|
|
|
|
|
Total Current Lenders |
835,700 |
7,700,000,000 |
23,350,000,000 |
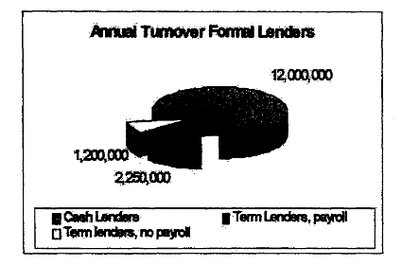
Figure 6: Annual Turnover Formal Lenders
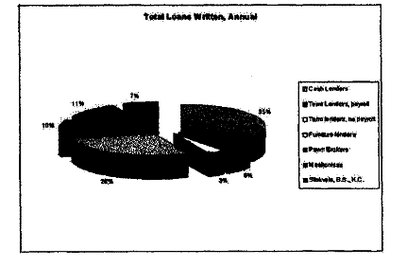
Figure 7: Total Loans Written: Annual
2.4.6 Loan Product Overview Table
The table below presents a rapid summary of the different kinds of lenders and their products. This table clearly indicates that there are a great number of different products being offered by many different kinds of institutions. The approximate figures for interest rates presented below indicate the wide spread that exists in the market and how much the effective rates can vary from their nominal rates. Risk can vary by loan and by product because of the nature of the security that is provided, the term of the loan, and the method of repayment, among others. But institutional efficiency has the greatest impact on the cost of lending for the type of institution. At the same time, it is impossible to put a single cost of lending next to each of the different products, as the cost of lending is really institution specific, not product specific.
Table 9: Overview of loan products in the South African Market, by institution
|
Type of Lender |
Size of loan |
Term of loan |
Repayment period |
Expressed cost |
APR |
Method of collection |
Type of security |
Default rate |
||||
|
Cash lender |
R 50-100 |
<7 days |
End of month |
free |
0% |
Bank card + pin |
Bank card |
Na |
||||
|
Cash lender |
R 100-500 |
7-25 days |
End of month |
30% flat |
540% -1040 % |
Bank card + pin |
Bank card |
5% per month |
||||
|
Cash lender |
R 500 |
30 days |
End of month |
30% |
360% |
Bank card + pin |
Bank card |
5% per month |
||||
|
Cash lender |
R 500 |
25-30 days |
End of month |
30% |
360-450% |
Bank card + pin |
Bank card |
5% per month |
||||
|
Cash lender |
R 500 |
25-30 days |
Weekly |
30% |
640-780% |
Bank deduction |
None |
3% per month |
||||
|
Cash lender |
R 500 |
25-30 days |
monthly |
30% |
540%1040% |
Cash payment (after bank card disallow.) |
None |
7% per month |
||||
|
Cash lender |
1,500 -3,000 |
<6 months |
Monthly |
12.5% |
287% |
Bank deduction |
Known client |
2% per month |
||||
|
Cash lender |
<10,000 |
<24 mo. |
Monthly |
10.5 |
242% |
Cash payment |
Known client |
??? |
||||
|
Cash lender |
<6000 |
3 months |
Monthly |
8.5% |
153% |
Cash payment |
Credit screening |
|||||
|
Term lender |
2,000-6,000 |
6-12 mo. |
Monthly |
3.5% |
78% |
Bank deduction |
Payroll |
?? |
||||
|
Term lender |
<9000 |
24 mo. |
Monthly |
2.46% |
57% |
Bank deduction |
payroll |
|||||
|
Term lender |
>2000 |
12 months |
Monthly |
29.5% |
45%-88% |
Off payslip |
payroll |
?? |
||||
|
Organised furniture lender |
R1,000 |
>6 months |
Monthly |
Highly variable |
Bank deduction, cash payment |
Credit screening |
Na |
|||||
|
Clothing lender |
R1,000
|
>6 months |
Monthly |
Highly variable |
Cash payment |
Credit screening |
Na |
|||||
|
Housing Term lender |
12 - 36 months |
Monthly |
15% |
24% |
Bank deduction |
payroll |
||||||
|
Housing Term lender |
R6,000 |
12 - 36 months |
Monthly |
26% |
48% |
Cash payment |
none |
|||||
|
ST Enterprise Lender |
R1,000 |
3 months |
Monthly |
4% per month. |
72% |
Cash payment |
None |
Varies drastically |
||||
|
ST Enterprise Lender |
R360 |
6 months |
Monthly |
100% |
420% |
Bank deposit |
None |
Up to 65% |
||||
|
ST Enterprise Lender |
100-2000 |
14-30 weeks |
Weekly |
40/100 14 wk; 45/100 20 wk; 49.7/100 30wk |
109.99% |
Cash payment |
none |
25% of turnover in 1999 |
||||
|
Term Enterprise lender |
R3,000 |
12 months |
Monthly |
Highly Variable |
Cash payment |
Varies drastically |
||||||
|
Spaza Shops |
R 500 |
5 days |
Weekly |
5% per week |
365% |
Cash payment |
None |
NA |
||||
|
Pawn Broker |
Any |
30 days |
At expiry of term |
30% |
360% |
Cash payment |
Deposited item |
33% |
||||
|
Mashonisa |
200-300 |
30-60 |
Monthly |
30-50% |
360 - 600% |
Cash payment |
None |
5% per month |
||||
|
Stokvel |
Varies |
|||||||||||
It is important to note for the cash microlenders that there is a definite cyclicality in their lending, so that they have large amounts of cash on hand for part of each month. Therefore, while the cost to the consumer, in terms of interest rate for a 7-25 day loan, is quite high, the revenue to the lender comes back to 30% per month, as he cannot relend the excess funds that he is holding.
[6] Deutsche Morgan Grenfell, March 2, 1999
[7] Conversations with Compuscan and MicroLenders Credit Bureau (MLCB)
[8] lnterview with Andrew Lukhele and Andrew Japp.